Team Dashboard
The Team Dashboard is the default view when you open Team Hub. It provides a high-level overview of your team’s training activity.
Overview Metrics
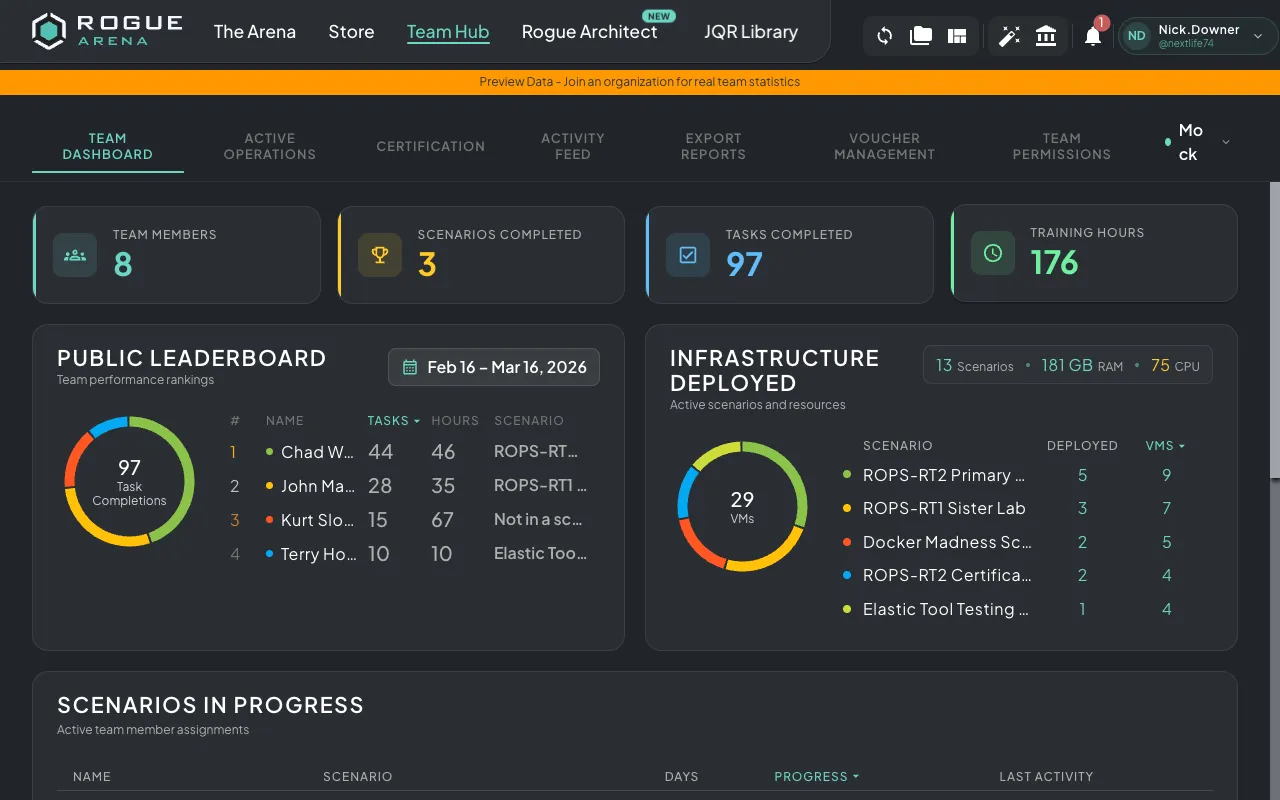
Section titled “Overview Metrics”At the top of the dashboard, four stat tiles show key team metrics:
- Team Members — Total number of members on your team
- Scenarios Completed — Total scenarios completed across all team members
- Tasks Completed — Total tasks (questions, objectives) completed
- Training Hours — Total time spent in lab environments
Leaderboard
Section titled “Leaderboard”The Most Active section ranks team members by their activity. You can sort by:
- Tasks completed
- Training hours
- Current scenario progress
This gives you a quick view of who is most engaged and who might need additional support.
Scenarios Section
Section titled “Scenarios Section”The Scenarios section shows all currently deployed scenarios for your team, including:
- Environment name and type
- Resource usage (RAM, CPU)
- Number of assigned users
- Deployment status
Scenario Completion
Section titled “Scenario Completion”Track per-user progress through assigned scenarios. See which team members have completed their scenarios and which are still in progress.
Activity Timeline
Section titled “Activity Timeline”A visual timeline chart shows team activity trends over time, including:
- Virtual machine usage
- VPN connection hours
- Task unlocks and completions
- Certification milestones
Use this to identify trends in team engagement and spot periods of high or low activity.