Active Operations
The Active Operations tab provides real-time visibility into all currently deployed environments and what your team members are doing inside them.
Required role: Team Manager or Org Manager
Operations Overview
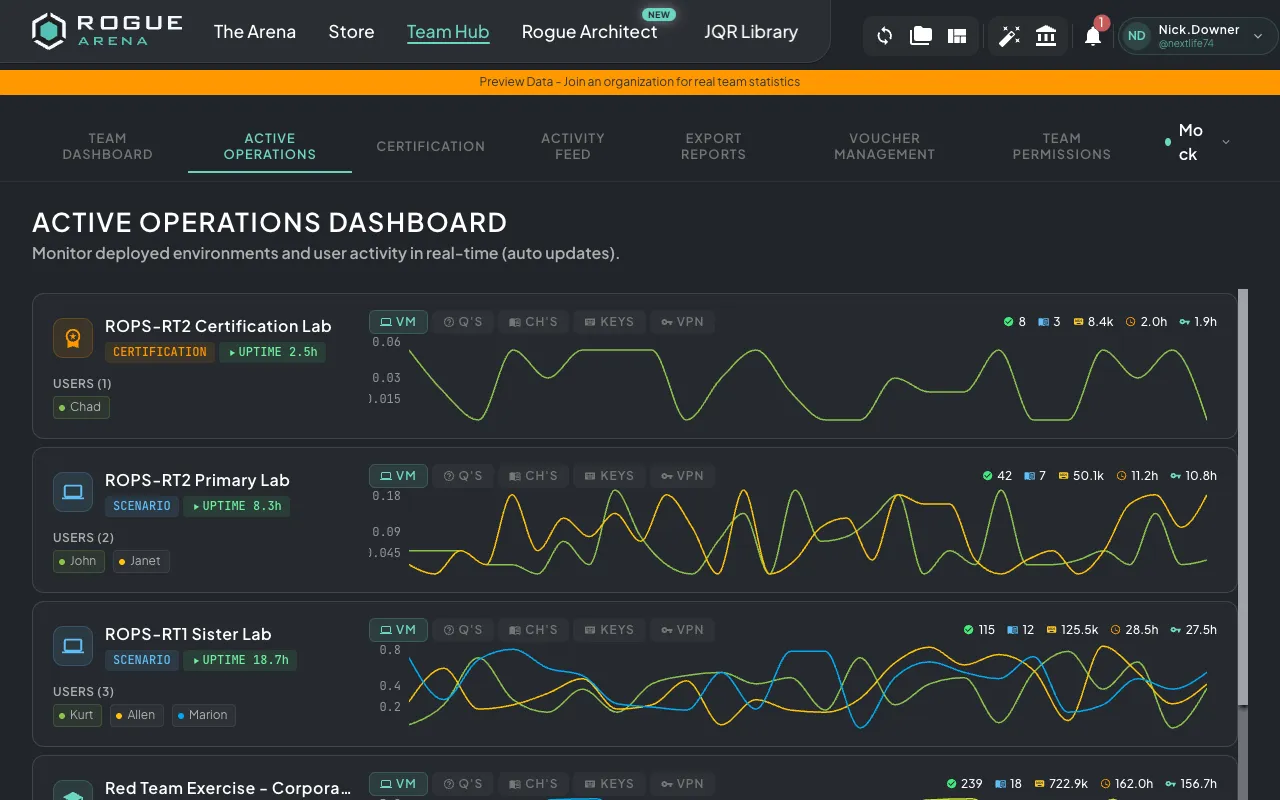
Section titled “Operations Overview”When you open Active Operations, you’ll see a grid of cards — one for each actively deployed environment. Each card shows:
- Environment name and type
- Uptime — How long the environment has been running
- Assigned users and their current activity
- Progress metrics — Questions answered, chapters completed
Real-Time Activity Monitoring
Section titled “Real-Time Activity Monitoring”Active Operations uses live WebSocket updates to show you what’s happening right now:
- VM Activity — Which users are actively using their virtual machines
- Keystrokes — Activity level indicators showing engagement
- Questions — Task completions as they happen
- Chapters — Section progress in real time
- VPN Usage — Who is connected via VPN
You can filter the view by metric type to focus on what matters most to you.
Operation Detail View
Section titled “Operation Detail View”Click on any environment card to open a detailed view showing:
- Activity Timeline — A time-series chart of user activity, with configurable time buckets (5-minute intervals up to weekly)
- User Contributions — Per-user breakdown of activity and task completion
- Curriculum Progress — Section-by-section, chapter-by-chapter progress with:
- Which questions each user has completed
- Which chapters are unlocked
- Overall completion percentage
- Question Detail — Click on any question to see individual user answers, including:
- Text responses
- Multiple choice selections (with correct/incorrect indicators)
- File upload submissions
- Timestamps for each submission
Collaboration Features
Section titled “Collaboration Features”If a scenario has Team Collaboration Unlock enabled, the detail view shows how the team is working together:
- Shared chapter unlocks across team members
- Whether chapters can be completed in any order
- Combined team progress toward unlocking new content